
How to monitor your home internet connection — and prove it to your ISP
- Networking , Monitoring
- February 24, 2026
Table of Contents
The video call freezes, the game lags, the trading terminal reconnects. A speed test five minutes later shows 500 Mbit/s and everything looks fine. You call your provider, they “see no issues on the line”, and suggest restarting the router.
The problem with intermittent internet issues is that they are intermittent. By the time you start investigating, they’re gone — and without evidence, everyone blames someone else: the Wi-Fi, the weather, the server on the other end.
What you need is continuous measurement of every link in the chain at the same time. That’s exactly what pingtrix does.
The idea: ping every hop at once
Between your laptop and, say, a video-conferencing server there are several independent links:
- Your device → home router — Wi-Fi or Ethernet cable.
- Home router → ISP gateway — the access line: fibre, cable, DSL, LTE.
- ISP → the internet — your provider’s backbone and its peering with others.
- The internet → target server — the remote network and the server itself.
If you ping all of these at once and lay the results side by side on a timeline, the faulty link becomes obvious: problems show up on that hop and every hop after it, while everything before it stays clean.
pingtrix pings any number of hosts concurrently and draws the results as a live, colour-coded chart in the terminal — one column per host, one character per ping.
Installation
pingtrix is a single binary with no dependencies, available for Linux, macOS and Windows (amd64 and arm64). Download the archive for your platform from GitHub Releases, unpack it and run it from a terminal.
Or run it with Docker without installing anything:
docker run --rm -it ghcr.io/bsv9/pingtrix 8.8.8.8 1.1.1.1
Notes per platform:
-
Windows — works without Administrator rights; it uses the same ICMP API as
ping.exe. -
macOS — works without
sudo. -
Linux — unprivileged ICMP may need to be allowed once:
sudo sysctl -w net.ipv4.ping_group_range="0 2147483647"(or just run pingtrix with
sudo).
Step 1: find the addresses of your hops
You need three or four addresses:
-
Router — your default gateway, usually
192.168.0.1or192.168.1.1. Check withipconfigon Windows,ip routeon Linux, ornetstat -rn | grep defaulton macOS. -
ISP gateway — the first hop after your router. Run a traceroute and take the second line:
traceroute -n 1.1.1.1      # macOS / Linux
tracert -d 1.1.1.1         # Windows
If it’s an address like
100.64.x.xor10.x.x.x, your provider uses carrier-grade NAT — that’s fine, it’s still their equipment. -
A stable public host —
8.8.8.8(Google DNS) or1.1.1.1(Cloudflare DNS). These are among the most reliable addresses on the internet. -
The service you actually care about — your company VPN, the game server, the broker’s API.
Step 2: run it
pingtrix 192.168.1.1 100.64.0.1 8.8.8.8 meet.example.com
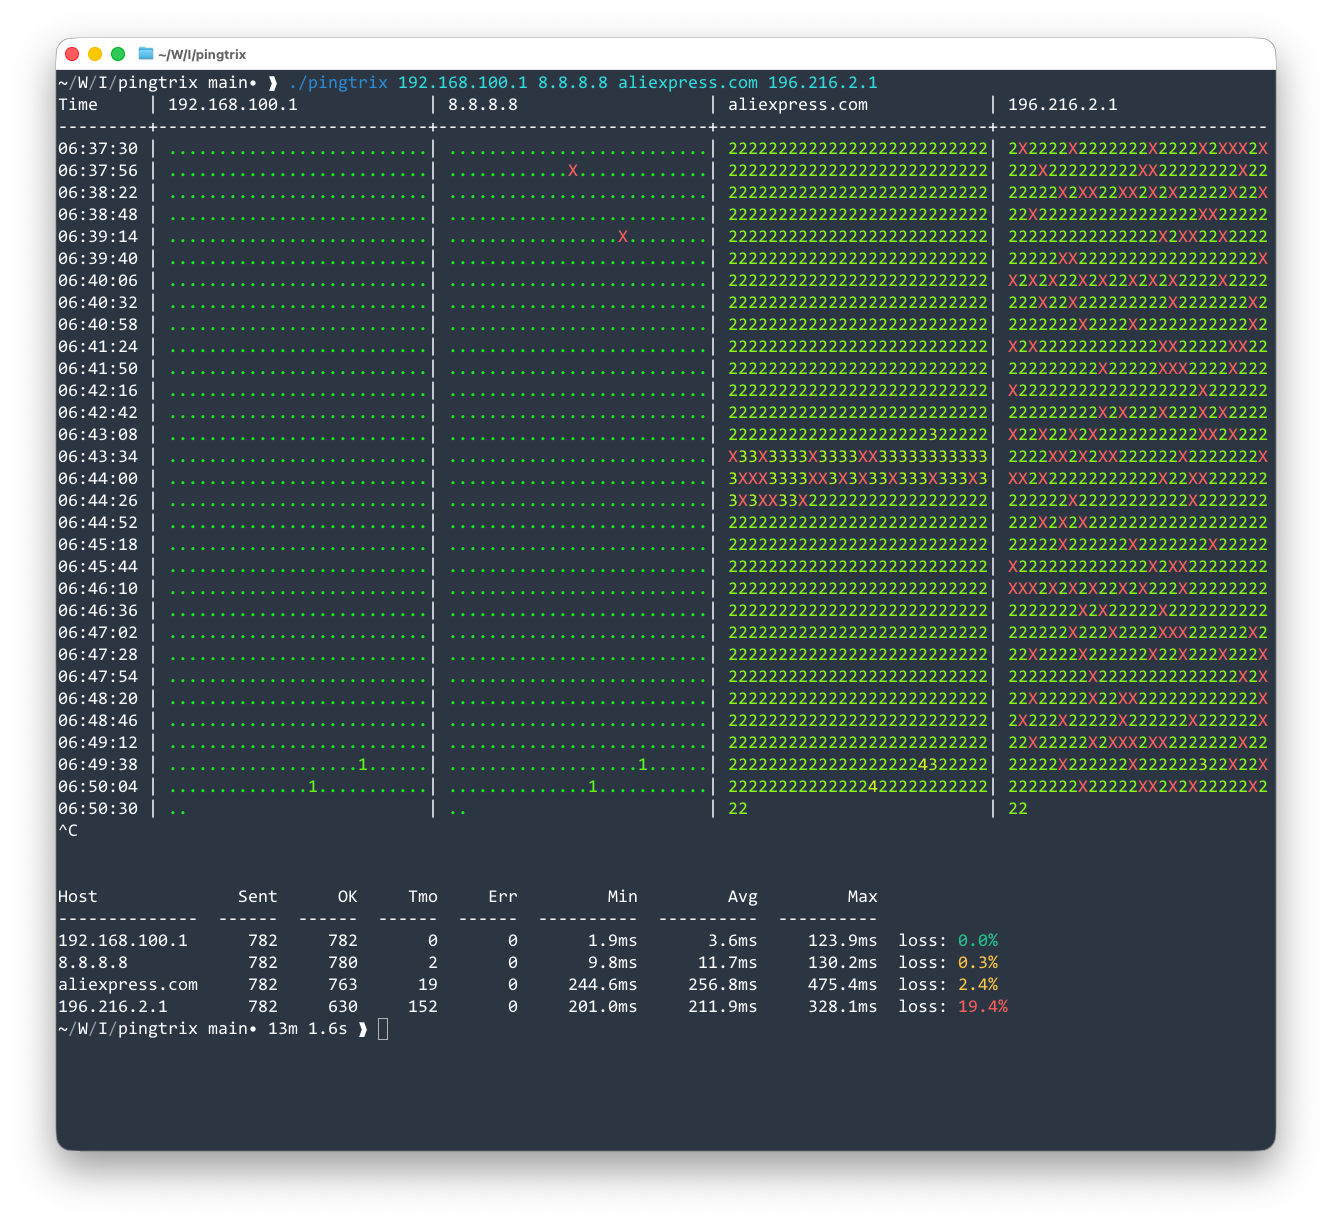
Each row starts with a timestamp and fills up with one character per ping:
| Symbol | Meaning |
|---|---|
. (green) |
Reply under 100 ms |
1 … 9 |
Reply in hundreds of milliseconds: 2 = 200–299 ms, 9 = 900 ms or more; colour shifts from green to red |
X (red) |
Timeout — packet lost |
! (yellow) |
Unreachable or DNS failure |
When you stop it with Ctrl+C, pingtrix prints a summary per host: packets sent, replies, timeouts, errors, min/avg/max latency and loss percentage.
Useful options:
# catch short drop-outs: ping every 200 ms with a 500 ms timeout
pingtrix -i 200ms -w 500ms 192.168.1.1 8.8.8.8

# leave it running for hours with a relaxed interval
pingtrix -i 5s -w 2s 192.168.1.1 8.8.8.8 meet.example.com
Step 3: read the chart
Look for the first column where Xs or high digits appear.
| What you see | Where the problem is |
|---|---|
| Losses already on the router | Inside your home: Wi-Fi interference, a weak signal, a bad cable, an overloaded router. Try a cable instead of Wi-Fi; if the losses disappear, it’s the wireless. |
| Router clean, losses from the ISP gateway onwards | Your access line or the provider’s equipment. This is the case to take to your ISP. |
| ISP gateway clean, losses on 8.8.8.8 and further | The provider’s backbone or upstream connectivity — still the ISP’s responsibility. |
| Everything clean except one target | The remote service or its network. Your connection is fine; the other side is not. |
| Latency grows every evening, 19:00–23:00 | Congestion — the provider’s capacity can’t keep up with peak load. |
The screenshot above is a good example of the last-but-one case: the router (192.168.100.1) and Google DNS are clean, with 0.0% and 0.3% loss, but one remote host shows 19.4% loss at a constant ~210 ms. No point in calling the home ISP — the problem is far away.
Note
Some routers and ISP devices deliberately give ICMP low priority or rate-limit it. If an intermediate hop shows occasional Xs but every hop after it is clean, that is not real packet loss — traffic passing through the device is fine, it just doesn’t bother answering pings. Real problems propagate down the chain.
Step 4: collect evidence
For a conversation with the provider, a screenshot is good — but logs are better. With -d, pingtrix writes everything to files:
pingtrix -d ./logs 192.168.1.1 100.64.0.1 8.8.8.8
This produces:
- a CSV file with a Unix timestamp and the round-trip time of every host for every tick (
Xfor timeout,!for unreachable) — easy to open in a spreadsheet or plot; - a plain-text log per host in the same
./Xformat, each line prefixed with date and time, which is easy to read and to attach to a support ticket.
Leave it running for a day or two. When you contact support, you can now say: “Between 19:40 and 21:15 on 23 February, 8 % of packets to your gateway 100.64.0.1 were lost while my router showed 0 % — logs attached.” That is a very different conversation from “the internet is slow sometimes”.
To keep it running permanently, use any always-on machine at home — a Raspberry Pi, a NAS or a home server — with Docker:
docker run -d --name pingtrix --restart unless-stopped -t \
  -v /srv/pingtrix:/logs \
  ghcr.io/bsv9/pingtrix -i 2s -d /logs 192.168.1.1 100.64.0.1 8.8.8.8 1.1.1.1
Measuring from a wired machine also removes Wi-Fi from the equation: if the home server sees a clean line while your laptop sees losses, the problem is wireless.
Summary
- Ping the router, the ISP gateway, a public DNS server and your target at the same time.
- The first hop where losses appear — and stay — is where the problem is.
- Ignore losses on intermediate hops that don’t propagate further.
- Write logs with
-dand give your provider facts, not feelings.
pingtrix is open source under the MIT license: github.com/bsv9/pingtrix. It was inspired by ping-xray, reimplemented as a single Go binary with no external dependencies.
Need proper monitoring for an office or company network rather than a home connection? Talk to us — Zabbix, Prometheus and Grafana are our daily tools.


